Telemetrix GridBox Meter Data Management
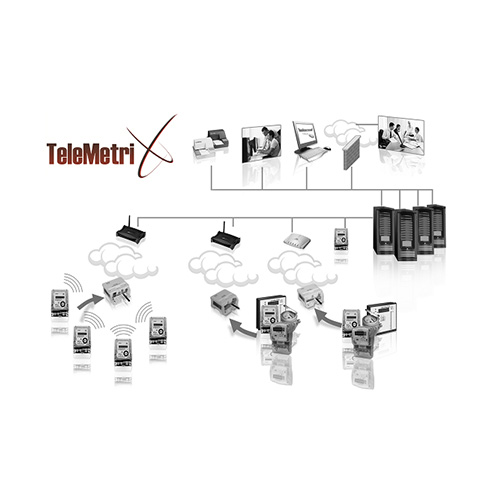
TeleMetriX energy management software is a multi-utility Meter Data Management System that processes real time data from electricity, water, gas meters and communication devices by applying strong validation rules.
Thanks to multi-layered independent architecture, it allows to apply any devices into the system.
The essential design criteria of the system is “flexibility”. All interfaces, search windows, reports are customizable. Report design interface allows the user to create unique reports in addition to predefined reports.
Users can easily create the reports by drag and drop function. The software perfectly answers all metering requirements for Electricity/Water/Gas
Utilities, Industrial Zones, Smart Buildings and industrial facilities.
The software is %100 web-based. This ensures to monitor different systems at the same time.
Raw data and validated data are stored in different databases.
This type of architecture keeps the operation data in a very small size. Additionally, support and maintenance periods will be very short.
The software infrastructure is equipped with a robot, Gbot that manages server resources and services efficiently.
MAIN FUNCTIONS
- TeleMetriX is designed by cutting edge technologies
- It has a modular structure where modules can run independently from each other.
- It is flexible and expandable from small to big scale applications
- Head-End Module TeleMetriX operates independently
- All local rules can be applied to the system
- Network Design Module (Sub-station)
- Loss- Leakage Analysis Module
- Grid Management
o Subscriber Module
o Energy Retailer Module
o Power Generation Module
o Field Management Module - GBOT System Robot
- Each user can create his own screens based on different needs
- All actions in the software can be classified, restricted and permitted based on roles of the users
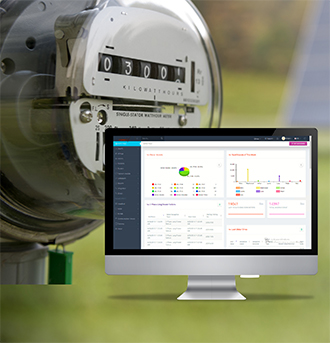
Users can design individualized dashboards on the application interface and share their own widgets and dashboards with other users. They can add any parameter available in the system to their dashboard. There is no limitation in
terms of revision to dashboards.
Network module presents on-site device maps and detail reports pinned on the particular location. The devices are shown also in summary reports in the particular location zoomed. It is possible to make a detailed analysis through search functionality in the particular region.
The steps that needs to be run can be planned and run through the scenario editor.
Reports such as Monthly Production & Consumption Profiles, Hourly Profiles, Trends, other interval data and Month End Read-Outs and
Month End Indices can be taken to verify production, distribution and consumption. Meter replacements, cut-offs, meter failures, battery
status, signal strength, time deviations are reported and controlled through this interface.
Hourly (load) profiles can be reported on selected time intervals. Filtering and reporting on a variety of criteria is available.
Tariff values and other parameters can be reported for the selected meters. Consumption trends can be analysed on the interface.
Users can also create custom reports through this interface by drag and drop. They can save the templates and share them with other users. Through the lost and leakage report, the measured substations and the consumption values of the meters connected to the substation can be compared and lost and leakage can be reported. Action can be taken for stations and regions with high loss and leakage levels.
The raw data is analysed in the Module based on predefined rules
· Analysed data can create work orders, reports, SMS or email automatically
· Except from standard VEE (Validation, Estimation Editing) functions, authorized people can create own rules


